Analytics Guide
Building Custom Analytics Dashboards for Business
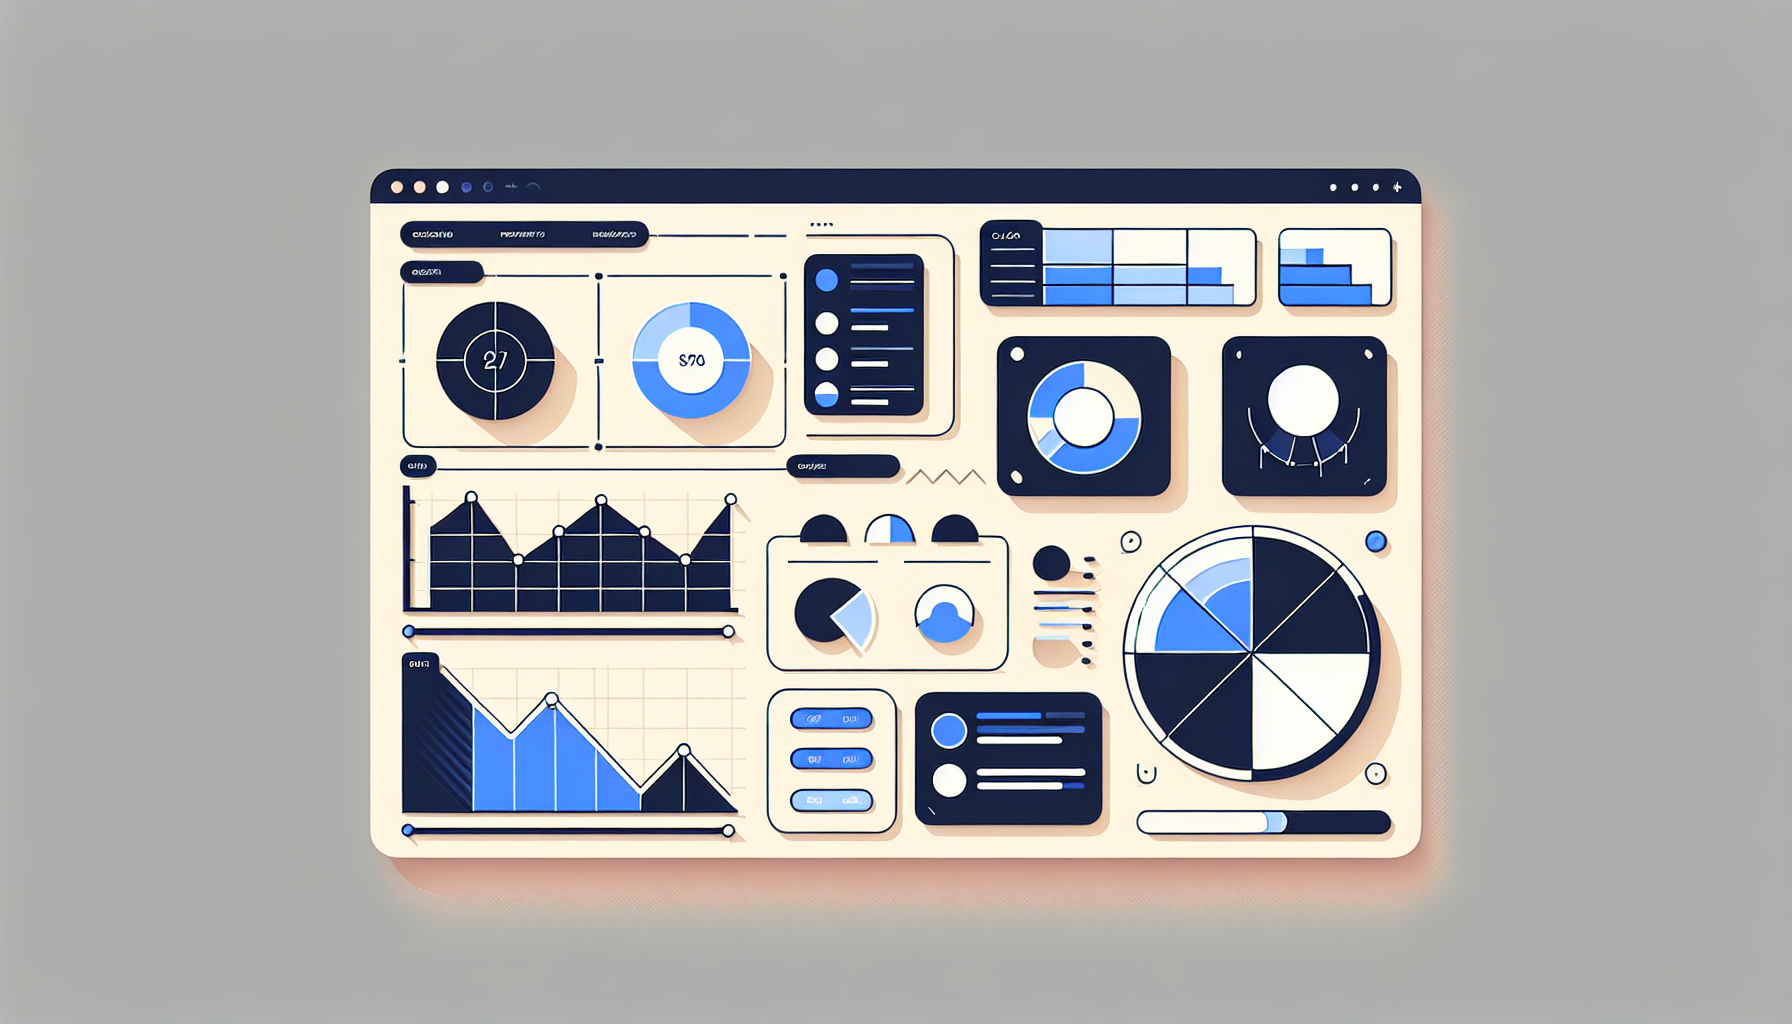
Analytics dashboards surface the metrics that drive decisions. Custom when off-the-shelf can't do it. Data pipeline, visualization, delivery. Here's how.

Table of Contents
Data Pipeline
ETL from DBs, APIs, events. Warehouse (BigQuery, Snowflake) or direct. Batch or streaming. See our Custom Reporting guide.
Metrics & Calculations
Define KPIs. Pre-aggregate for performance. dbt for transformations. Consistency in definitions.
Visualization
Charts, tables, filters. Metabase, Looker, or custom (Recharts, D3). Role-based views. See our Custom Dashboards guide.
Delivery
Web dashboard, scheduled email, Slack. Embed in app. Export to Excel/PDF.
Frequently Asked Questions
Metabase vs custom?
Metabase for standard BI, quick setup. Custom when: embedded in product, unique metrics, or real-time requirements.