Custom Reporting Systems for Business Intelligence
Off-the-shelf BI tools work for standard reporting. Custom reporting fits your metrics, data sources, and workflows. Dashboards, scheduled reports, data pipelines — here's when and how to build custom reporting.
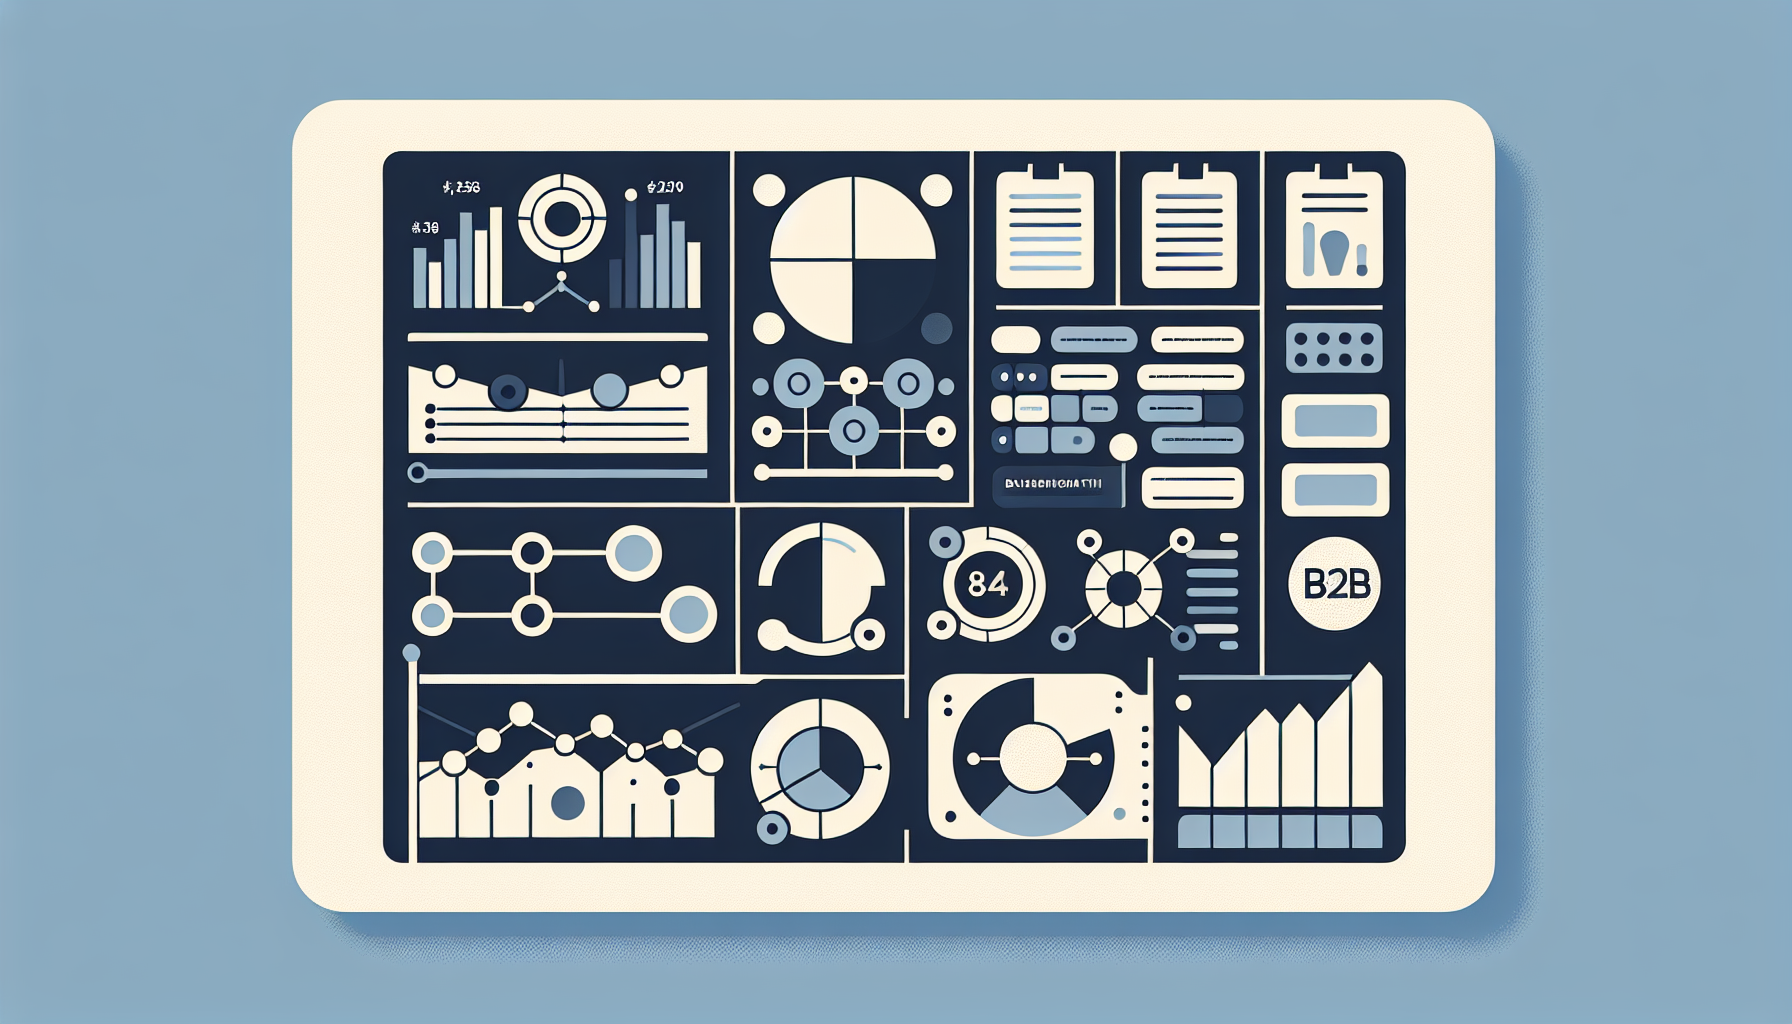
Table of Contents
- When to Build Custom
- Key Components
- Data Pipeline
- Delivery & Access
- Tools vs Custom
- Frequently Asked Questions

When to Build Custom
- Multi-source data — CRM + ERP + custom DB
- Unique metrics — standard BI can't calculate
- Embedded in your app — reports inside product
- Real-time — not batch
- Compliance — specific audit, retention requirements
Key Components
Data layer: ETL or API aggregation. Metrics: Calculated fields, KPIs. Visualization: Charts, tables, dashboards. Delivery: Web, email, export. See our Custom Dashboards guide.
Data Pipeline
Pull from DBs, APIs, files. Transform (join, aggregate, calculate). Load into warehouse or cache. Batch (nightly) or streaming. Tools: dbt, Airflow, or custom.
Delivery & Access
Web dashboard, scheduled email (PDF/Excel), export to S3. Role-based access — finance sees P&L, sales sees pipeline.
Tools vs Custom
Metabase, Looker, Tableau — for standard BI, single-source. Custom when multi-source, embedded, or unique logic. Hybrid: warehouse + Metabase for most, custom for edge cases.
Frequently Asked Questions
How much do custom reporting systems cost?
Simple (5–10 reports, one source): $20K–40K. Complex (multi-source, real-time, embedded): $60K–120K. Ongoing: maintenance, new reports.
Explore Further
Need Custom Reporting?
We build reporting systems for finance, operations, and more.
Book Consultation